MSA (Measurement System Analysis)
MSA is one important core tool in our quality management system. Like we have done consider of the four core tools in the previous concepts.
Well today, we are going to talk about MSA, a core tool of quality management system.
So lets start,
Today, we are covering following points in this topic:
- INTRODUCTION
- SOURCE OF VARIATION
- FUNDAMENTAL PROPERTIES OF A GOOD MANAGEMENT SYSTEM
- ACCURACY & PRECISION
- GAUGE R & R
- BIAS
- LINEARITY
- STABILITY
- REPEATABILITY
- REPRODUCIBILITY
IATF 16949:2016, which is an important part of quality management system for automotive industries. According to its clause no. 7.1.5.1.1 measurement system analysis, statistical studies shall be conducted to analyse the variance present in the results of each type of inspection, measurements, and testing equipment system.
SOURCE OF VARIANCE:
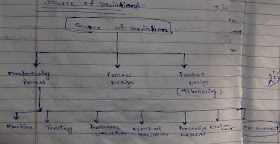
The source of variation can vary, it may come due to manufacturing process, it can also come due to process variation or product variation. There may be many reasons in the manufacturing processes, such as machining, tooling, parameter variation, method variation, variation in materials, environment & measurement.
In all of these variations, Today, we are going to understand the variation of measurement system.
In all of these variations, Today, we are going to understand the variation of measurement system.
FUNDAMENTAL PROPERTIES OF A GOOD MEASUREMENT SYSTEM:
- The sensitivity of the measurement system must be adequate. It is mandatory for the instrument capturing the variation of measurement system to be sensitive. This means that 1/10th of the tolerance should be the least count of the instrument. It is also called 10 to 1 rule.
- The measurement system must be under statistical control. Only the presence of common causes of variation and not the special causes.
ACCURACY & PRECISION:
We will understand this topic from an example.
Condition- 1
 |
| Example pic. 1.1 |
A shooter is shooting his target. In its shown center plus mark, which is the target value. Here the shooter has shot at various points. These points are seen far away from each other. Due to which it is neither precise nor accurate.
Condition- 2
 |
| Example pic. 1.2 |
Here all the points are around the target, so there is accuracy but not precision.
Precision means that when all the points are located close to each other, there will be precision.
Accuracy means that when all the points are located around the target, that is accuracy.
Condition- 3
 |
| Example pic. 1.3 |
Here all the points are located close to each other, but away from the target. So there is precision, but not accuracy.
Condition- 4
 |
| Example pic. 1.4 |
Here all the points are both accuracy and precise.
I hope you understood this topic from example very well. Hope you like this.
GAUGE R & R:
It is a means of assessing the repeatability and reproducibility of our measurement system.
In this, we understand how much measurement system is contributing to the total variation of the process. Gauge R & R studies are done to find out how much the variation of the process is due to the measurement devices and measurement methods.
Both accuracy and precision are not the same. If there is an accuracy error in the measurement system, then the result of measurement shown the locational error.
If there is a precision error in the measurement system, then the spread error will be shown in the result of measurement error.
BIAS:
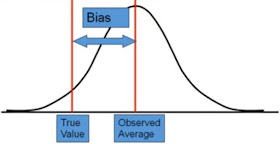
It is the difference between the observed average of the measurement, and the true value. It is also called an error.
True value:
The value that is checked with a high precision instrument.
Observed average:
Average value that is the average of multiple reading taken from an instrument.
To find the Bias, the Observed average is subtract to the true value, then the difference that comes out, is called Bias. The report noted a bias or error when calibrating the instrument.
To find the Bias, the Observed average is subtract to the true value, then the difference that comes out, is called Bias. The report noted a bias or error when calibrating the instrument.
LINEARITY:
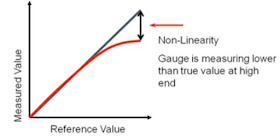
It is the difference in bias value over the expected operating range of the measurement gauge.
That is, if you have taken a vernier caliper, the vernier caliper range is from 0 mm to 300 mm. Then you will check the bias at different points in it's operating range i.e. from 0 mm to 300 mm. If the bias of the instrument is zero at every point, then you will call the instrument linear. And if bias is not coming zero, then it will be called non linear. So your instrument should be ideally linear.
STABILITY:
It is the variation in the average over an extended period of time using the same gauge and appraiser to repeatedly measure the same part.
If the same appraiser or inspector taking readings from the instrument at different times from the same gauge, the study is called a stability study. Stability, basically process variation; like here is the measurement process, so the variation of the measurement process tries to understand over a period of time.
If the same appraiser or inspector taking readings from the instrument at different times from the same gauge, the study is called a stability study. Stability, basically process variation; like here is the measurement process, so the variation of the measurement process tries to understand over a period of time.
REPEATABILITY:
In this, we try to understand the difference that the same inspector check the same part, the same parameter, using the same gauge quite frequently, that study is called repeatability.
REPRODUCIBILITY:
In this, different inspectors check the same part, same parameter, using the same gauge, quite frequently, that the study is called reproducibility.
So friends, for today that's all. Click on follow button "Become a member" right top corner to stay connected with us.
Thank you for visiting.
So friends, for today that's all. Click on follow button "Become a member" right top corner to stay connected with us.
Thank you for visiting.
Some of a related question that help to improve your basic knowledge.


No comments:
Post a Comment
If you have any doubt, please let me know